
MON - FRI 8AM - 5PM

Top 10 Vibration Measuring Devices for Industrial Buyers

A vibration reading can reveal a developing fault before a motor becomes hot, noisy, or costly to repair. But the instrument must suit the machine, the measurement point, and the skill of the person using it. A handheld meter may work well for routine checks on pumps and fans. A data collector or online system may be better for critical assets that need trend monitoring. Small details matter.

Paraphrasing vibration-analysis educator Jason Tranter, a useful principle is: “A measurement earns its value when it helps someone make a sound maintenance decision.” This is not a verbatim quotation. It reflects a practical concern for industrial buyers: a high specification alone does not guarantee useful results. Sensor range, frequency response, mounting method, software, calibration support, and ease of use all affect the quality of a measurement. A probe pressed against a painted bearing housing, for example, may produce less dependable data than a properly mounted sensor. That distinction is easy to miss.

This guide compares 10 Vibration Measuring Device options for industrial applications, from portable vibration meters to advanced analyzers. It considers where each device fits, what buyers should verify, and which trade-offs deserve attention. No tool is perfect. Some offer detailed diagnostics but require training; others are simple to use but provide limited fault information. The right choice depends on asset criticality, inspection frequency, operating conditions, and available expertise. Even a careful shortlist cannot replace a clear measurement plan.
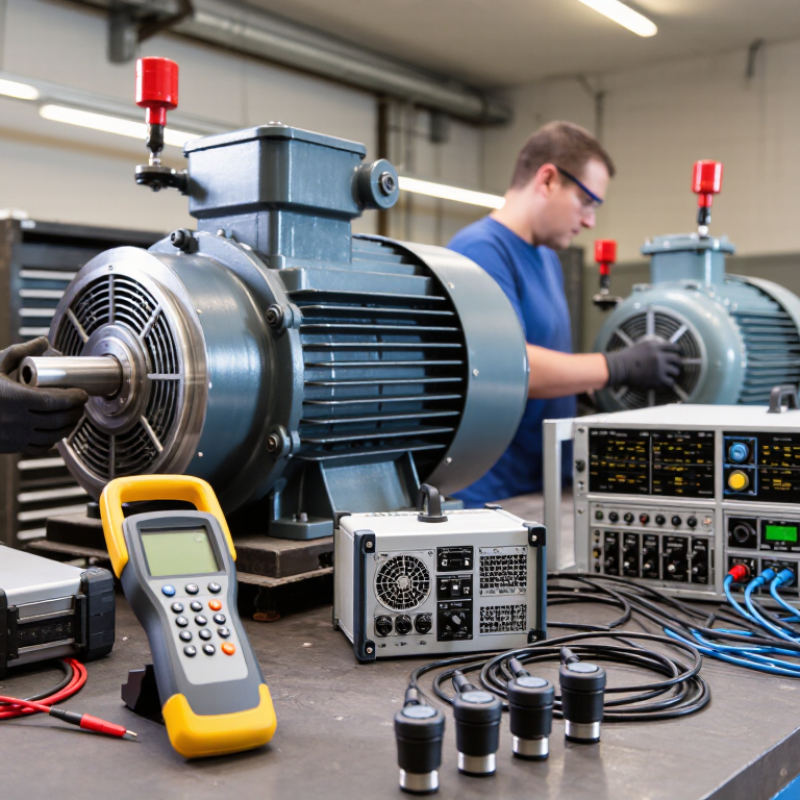
Top 10 Vibration Measuring Devices for Industrial Buyers

Defining Industrial Vibration: Displacement, Velocity, and Acceleration

Industrial vibration describes motion in three useful ways. Displacement measures how far a machine part moves, usually in micrometres or mils. It helps reveal large, slower shaft movement. Velocity measures how quickly that movement changes, commonly in millimetres per second. It is widely used to assess overall machine vibration. Acceleration, measured in metres per second squared or g, responds strongly to rapid impacts and bearing defects.

Picture a pump casing vibrating beside a steel pipe. A displacement reading may show a slow, broad shaft motion. Velocity can indicate the machine’s general vibration severity. Acceleration may catch a sharp bearing pulse before it feels obvious by hand. ISO 20816-3:2022 covers many industrial machines above 15 kW, running from 120 to 30,000 revolutions per minute, and evaluates vibration using measurement criteria that include RMS velocity. That operating range is useful context, not a universal pass/fail limit.

The U.S. Department of Energy’s Operations & Maintenance Best Practices guide describes vibration analysis as a predictive maintenance technique. In practice, sensor location, mounting, speed, and frequency range all affect readings. A handheld probe on a rough casing can produce a number that looks precise but misses the real fault. This is easy to overlook. Match the measurement to the machine and suspected problem, then compare readings at consistent points over time.

ISO 20816-3: Vibration Evaluation for Machinery Above 15 kW

For machinery rated above 15 kW, ISO 20816-3 offers a framework for evaluating vibration in industrial equipment. It applies to specified machine types operating from 120 to 30,000 r/min. That range matters. The standard considers machine group, support conditions, and vibration severity zones; it does not set one universal limit for every machine. Buyers should look for devices that provide repeatable mounting, an appropriate frequency range, and clear RMS velocity readings. Access to spectra or raw waveforms can help diagnose changes. Mounting matters. Take horizontal, vertical, and axial readings at comparable speeds and loads, then compare results with the correct machine category.

The U.S. Department of Energy’s Operations & Maintenance Best Practices Guide, Release 3.0, reports potential predictive-maintenance benefits of 25–30% lower maintenance costs and 35–45% less downtime. These are estimates, not guarantees. Vibration monitoring helps only when readings lead to inspection and action. A persistent once-per-revolution component may suggest imbalance, while looseness can produce less consistent patterns. Still, process changes, sensor placement, and field noise can confuse interpretation. A precise instrument cannot rescue a poor measurement routine. Keep a record of sensor location, operating speed, load, and any maintenance performed; otherwise, trend comparisons may be misleading.

Sensor Technologies: Accelerometers, Velocity Sensors, and Proximity Probes

Industrial buyers should match the sensor to the motion they need to measure. Accelerometers detect acceleration across a broad frequency range, making them useful for identifying bearing impacts and high-frequency vibration. Mounting matters: a loose magnetic base can distort readings, while a fixed stud usually provides better repeatability. Velocity sensors report vibration speed directly and suit many machine-condition checks, especially where overall vibration severity is the concern. Proximity probes work differently. They measure shaft movement without contact, so they are valuable on machines with fluid-film bearings, but require a suitable target and stable installation.

The U.S. Department of Energy’s Operations & Maintenance Best Practices guide estimates predictive maintenance can save 8–12% compared with preventive maintenance, and 30–40% compared with reactive maintenance. Those figures describe maintenance programs, not a guaranteed return from buying a sensor. Not quite that simple. Sensor choice, placement, operating speed, and baseline quality all affect what technicians can trust. A probe may show shaft motion while a casing-mounted accelerometer shows housing vibration; the readings are not interchangeable. Buyers should confirm measurement units, frequency range, mounting method, and compatibility with their monitoring system before comparing devices. Even then, thresholds may need revision after real operating data arrives.

Top 10 Vibration Measuring Devices: Representative Frequency Bandwidth

The chart compares representative upper frequency limits, in hertz, across common vibration measurement technologies. These are indicative examples, not universal specifications: actual bandwidth depends on the sensor, signal conditioner, mounting, and measurement setup. Check the device datasheet for application-specific limits.

Comparing the Top 10 Devices by Range, Bandwidth, and Data Logging

A useful comparison of ten vibration measuring devices starts with the measurement, not the feature list. For small rotating equipment, a low acceleration range can reveal subtle changes without sacrificing resolution. Heavy impacts may require a higher range to avoid clipped readings. Check the usable frequency bandwidth too: a meter that misses high-frequency energy could overlook early bearing wear. Wider bandwidth is not automatically better if the sensor, mounting method, or sampling rate cannot support it.

Data logging separates quick inspection tools from devices suited to trend analysis. Check how many readings each unit stores, whether it records timestamps, and how easily data transfers for review. A technician comparing readings across shifts needs consistent settings and clear records. A large memory count means little if files lack context. Small details matter. Battery life, sensor cables, and magnetic mounting can affect measurements on a noisy factory floor.

Compare the ten candidates under the same conditions where possible: same machine, measurement point, and operating speed. Review range, bandwidth, and logging capacity together rather than scoring each feature alone. A compact device may be easier to carry, while a larger unit may offer better recording controls. The trade-off is not always neat. Confirm calibration status and read the stated frequency response carefully; specifications can be presented in ways that are difficult to compare directly.

Calibration and Selection: Applying ISO 16063-21 to Vibration Transducers

For industrial buyers, a transducer’s sensitivity value is only useful when its calibration conditions match the measurement task. ISO 16063-21 describes vibration calibration by comparison with a reference transducer. A laboratory applies vibration to both sensors, then compares their outputs across selected frequencies. Check that the calibration certificate identifies the frequency range, sensitivity, uncertainty, and relevant mounting conditions.

Setup details affect results. A technician may mount the sensors side by side on a shaker, tighten them consistently, and check alignment before testing. Cable movement, poor contact, or a loose stud can distort readings. Small details matter. Ask whether the reference transducer has traceable calibration and whether the laboratory’s uncertainty is suitable for your process. A certificate alone does not prove that a sensor will perform well on a hot, noisy machine.

Selection should start with the machine, not the catalog. Match the transducer’s frequency range, measurement range, sensitivity, temperature rating, and mounting method to the expected vibration. For example, a compact sensor on a motor bearing may need a different range and mounting approach than one used on a large press. Compare calibration data at frequencies near your operating conditions, and confirm that the sensor’s output works with your data system. In practice, buyers sometimes overlook cable and mounting effects. It is worth checking those assumptions with the people who will install and use the device.

Top 10 Vibration Measuring Devices for Industrial Buyers - Calibration and Selection: Applying ISO 16063-21 to Vibration Transducers

Rank Device Type Sensing Principle Typical Measurement Range Typical Frequency Range Best-Fit Applications ISO 16063-21 Calibration Considerations Key Selection Checks
1 General-purpose IEPE accelerometer Piezoelectric sensing with an integrated signal-conditioning circuit Commonly ±50 g to ±500 g, depending on model Often a few hertz to several kilohertz Routine machine-condition monitoring, pumps, motors, fans, and gearboxes Calibrate the accelerometer as a transducer using the comparison method. Record sensitivity versus frequency, mounting, orientation, and measurement uncertainty. Check sensitivity, transverse response, temperature range, connector, cable compatibility, and required IEPE supply.
2 Low-noise piezoelectric accelerometer Piezoelectric sensing optimized for low signal noise Commonly ±5 g to ±100 g Typically suited to low-level vibration through the kilohertz range Precision diagnostics, low-vibration machinery, and structural testing Comparison calibration can establish frequency-dependent sensitivity. Ensure the calibration setup has adequate signal-to-noise ratio at the lowest levels. Compare noise floor, sensitivity, mass, mounting method, and cable-motion sensitivity with the application.
3 High-shock piezoelectric accelerometer Piezoelectric sensing with a mechanically robust construction Often ±1,000 g to tens of thousands of g Typically hundreds of hertz to several kilohertz; model dependent Impact testing, drop tests, shock events, and severe-duty machinery ISO 16063-21 comparison calibration is relevant to sinusoidal vibration sensitivity; it does not by itself characterize every transient-shock response. Check shock limit, resonance, mounting strength, cable retention, and whether separate shock calibration is required.
4 Charge-output piezoelectric accelerometer Piezoelectric element with charge output requiring an external charge amplifier Commonly from a few g to several thousand g Often from low frequencies to several kilohertz High-temperature locations, long-duration monitoring, and applications requiring sensor-only construction Calibrate the transducer and document the measurement chain separately. Cable and charge-amplifier settings can affect the measured result. Check operating temperature, cable insulation, amplifier input range, leakage, and system noise.
5 Triaxial accelerometer Three orthogonal sensing axes in one package Commonly ±10 g to ±500 g per axis Typically a few hertz to several kilohertz Three-dimensional machine surveys, structural response, and modal testing Each axis should be calibrated and identified independently. Maintain clear axis orientation and channel-to-axis traceability. Check axis alignment, cross-axis sensitivity, package mass, mounting footprint, and simultaneous-channel requirements.
6 MEMS accelerometer Capacitive micro-electromechanical sensing with analog or digital output Commonly ±2 g to ±200 g Often DC to hundreds of hertz or a few kilohertz Embedded condition monitoring, low-frequency motion, and compact wireless devices Where applicable, calibrate the sensing transducer by comparison and account for its electronic output chain. Confirm the usable band and signal processing settings. Check bandwidth, noise density, bias stability, sampling rate, anti-alias filtering, and environmental limits.
7 Seismic velocity transducer Electromagnetic coil-and-mass sensing Usually specified as velocity, commonly in mm/s or in/s Often designed for low-frequency machine vibration, with limits dependent on the model Low-speed rotating equipment and vibration monitoring where velocity is the preferred measure ISO 16063-21 can be applied to vibration transducers using comparison calibration when the operating frequency range and setup are suitable. Check natural frequency, mounting orientation, output type, low-frequency response, and compatibility with the monitor.
8 Eddy-current displacement probe system Non-contact inductive sensing of shaft displacement relative to the probe tip Typically a sub-millimeter to several-millimeter linear range Suitable for dynamic shaft motion within the system bandwidth Journal-bearing machines, shaft orbit measurement, and relative shaft vibration ISO 16063-21 is for vibration transducers; calibration of a complete displacement probe system may require additional displacement and target-material checks. Check probe gap, target material, linear range, extension cable, driver compatibility, and installation geometry.
9 Handheld vibration meter with external sensor Signal conditioner and display or processor used with an accelerometer Depends on the connected sensor; commonly reports acceleration, velocity, or displacement Depends on the sensor and the meter’s filters and processing Route-based maintenance checks and quick troubleshooting ISO 16063-21 applies to the transducer calibration, not automatically to the complete meter. Verify the meter’s signal processing and channel calibration separately. Check sensor compatibility, measurement units, frequency filters, data storage, and calibration interval.
10 Portable vibration analyzer with calibrated accelerometer Accelerometer input with digital acquisition and spectral analysis Determined by the sensor, input range, and analyzer configuration Determined by sampling rate, anti-alias filtering, and sensor bandwidth Fault diagnosis, spectral analysis, balancing, and field troubleshooting Calibrate the transducer by comparison where applicable, then verify analyzer channel gain, filtering, and end-to-end measurement performance. Check channel count, sampling rate, dynamic range, analysis functions, data export, and sensor calibration records.

Selection and calibration note: The ranges shown are indicative examples of common industrial configurations, not guaranteed specifications; actual limits vary by model and installation. ISO 16063-21 specifies comparison calibration of vibration transducers. Confirm the applicable frequency range, mounting method, environmental conditions, uncertainty, and traceability with the calibration provider. Calibrating a sensor alone does not automatically calibrate the complete measurement chain.

Request a Quote

To learn more about any of the products and services provided by Abbott Ball Company, Inc., simply complete the form below.